25% discount for Indian Students on DevOps + MLOps + AIOps Bootcamp

Troubleshooting as code on google cloud projects using gcpdiag
In this blog, I will talk about gcpdiag, an open-source command line tool by google cloud to identify cloud misconfigurations in google cloud projects.
Introducing gcpdiag, Google Cloud approach towards troubleshooting as code.
According to Gartner survey, until 2025, upto 99% cloud environment failures will be attributed to human errors, ie misconfigurations.
What is gcpdiag?
gcpdiag is a command line tool to automate the detection and troubleshooting of common google cloud misconfiguration issues using the information returned from Google Cloud API calls. It is an open-source tool maintained by the google cloud team.
gcpdiag is a command-line diagnostics tool for GCP customers. It finds and helps to fix common issues in Google Cloud Platform projects. It is used to test projects against a wide range of best practices and common mistakes, based on the troubleshooting experience of the Google Cloud Support team.
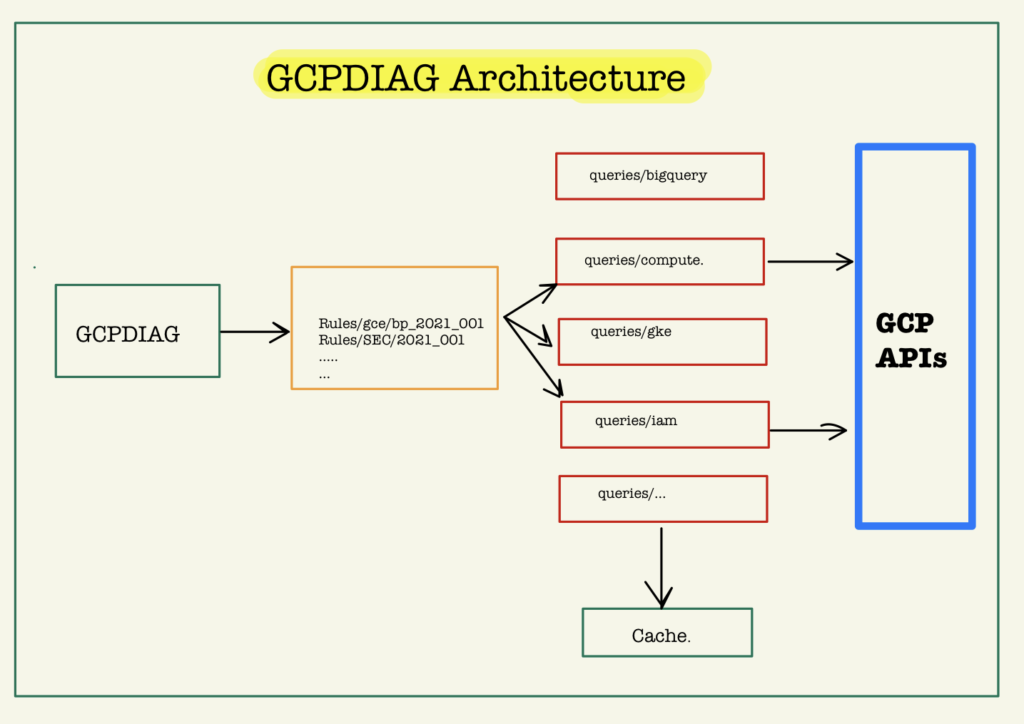
How gcpdiag works?
gcpdiag runs many automated checks, called rules, and creates a report about all the issues it detects. Currently gcpdiag ships with more than 70 rules that identify common problems like human errors, security issues, best practices, etc.
Rules are classified by the category of issues that they detect, some of them are —
# ERR for likely mistakes
# BP for best practices
# SEC for security issues
gcpdiag diagnostics can be targetted to run against all, or a selection of the following services:
- Apigee
- BigQuery
- CloudRun
- CloudSQL
- Composer
- DataFusion
- DataProc
- Google App Engine
- Google Cloud Build
- Google Compute Engine
- Google Cloud Functions
- Google Cloud Storage
- Google Kubernetes Engine
- Identity and Access Management (IAM)
- Load balancing (LB)
- Notebooks (Vertex AI Workbench Notebooks)
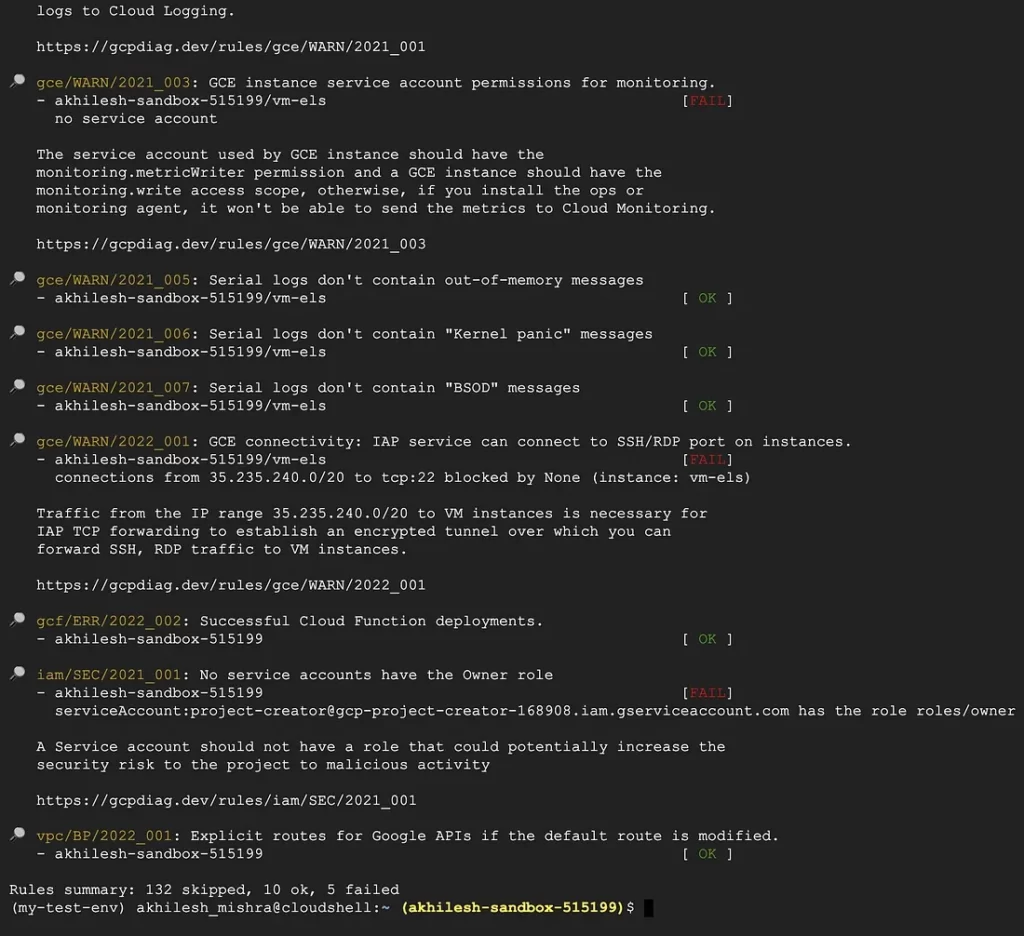
Here is an example of how the report generated by gcpdiag looks like
How to use gcpdiag?
Working with gcpdiag is pretty straightforward, just one command.
gcpdiag lint --project=PROJECT_IDYou can customize the output and restrict what rules to run using optional arguments.
gcpdiag lint --project=PROJECT_ID --include=gke \
  --exclude=bp --hide-ok
# Only run for gke rule, exculde best practices rules, and only show failed rules.
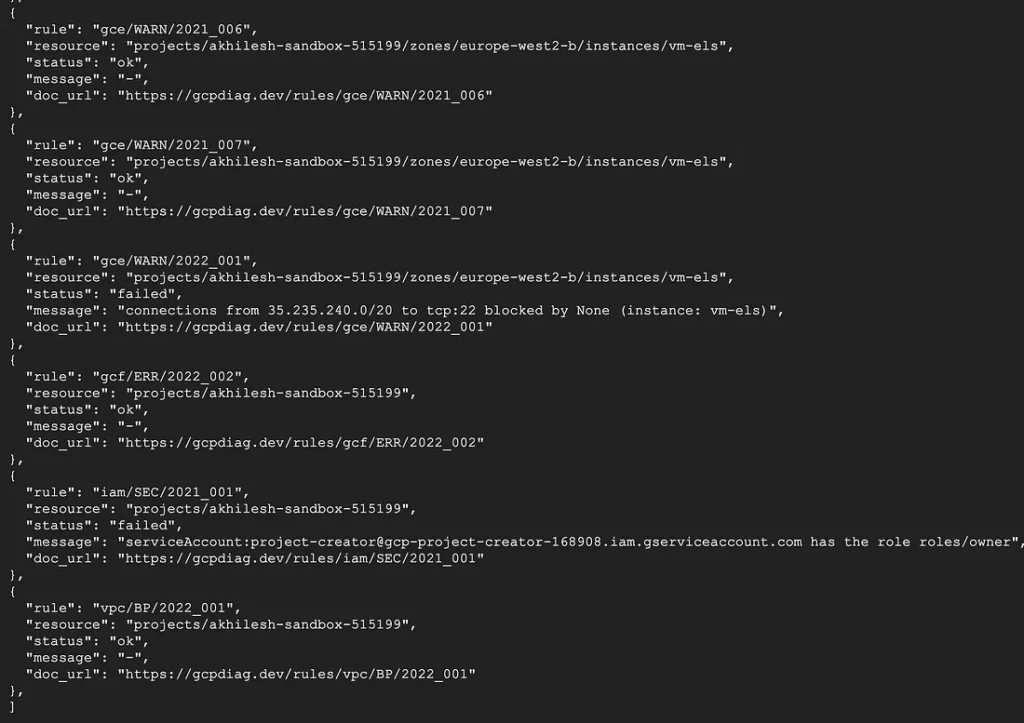
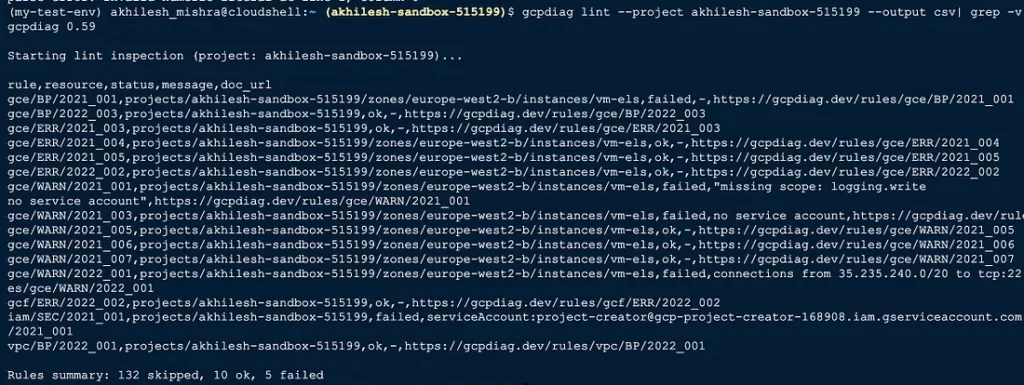
You can also format the output using output formatter, supported options are JSON, CSV, and terminal output.
gcpdiag lint --project=MYPROJECT --output json

gcpdiag lint --project=MYPROJECT --output csv > gcpdiag.report.csv
Here is what the output looks like in JSON and CSV format.
Here is the full list of supported arguments by gcpdiag.
gcpdiag lint --help

optional arguments:
  -h, --help            show this help message and exit
  --auth-adc            Authenticate using Application Default Credentials (default)
  --auth-key FILE       Authenticate using a service account private key file
  --project P           Project ID of project to inspect
  --billing-project P   Project used for billing/quota of API calls done by gcpdiag (default is the inspected project, requires 'serviceusage.services.use' permission)
  --show-skipped        Show skipped rules
  --hide-ok             Hide rules with result OK
  --include INCLUDE     Include rule pattern (e.g.: `gke`, `gke/*/2021*`). Multiple pattern can be specified (comma separated, or with multiple arguments)
  --exclude EXCLUDE     Exclude rule pattern (e.g.: `BP`, `*/*/2022*`)
  --include-extended    Include extended rules. Additional rules might generate false positives (default: False)
  --experimental-enable-async-rules
                        Run experimental async rules (default: False)
  -v, --verbose         Increase log verbosity
  --within-days D       How far back to search logs and metrics (default: 3 days)
  --config FILE         Read configuration from FILE
  --logging-ratelimit-requests R
                        Configure rate limit for logging queries (default: 60)
  --logging-ratelimit-period-seconds S
                        Configure rate limit period for logging queries (default: 60 seconds)
  --logging-page-size P
                        Configure page size for logging queries (default: 500)
  --logging-fetch-max-entries E
                        Configure max entries to fetch by logging queries (default: 10000)
  --logging-fetch-max-time-seconds S
                        Configure timeout for logging queries (default: 120 seconds)
  --output FORMATTER    Format output as one of [terminal, json, csv] (default: terminal)
How to install gcpdiag?
If you are using google cloud shell, gcpdiag is installed by default.
You can also run gcpdiag using a shell wrapper that starts gcpdiag in a Docker container. This should work on any machine with Docker or Podman installed.
curl https://gcpdiag.dev/gcpdiag.sh >gcpdiag
chmod +x gcpdiag
./gcpdiag lint --project=MYPROJECT
Before jumping to cloud shell and trying out gcpdiag, you need to take care of a few things.
Required APIs for gcpdiag
- cloudresourcemanager.googleapis.com (Cloud Resource Manager API)
- iam.googleapis.com (Identity and Access Management API)
- logging.googleapis.com (Cloud Logging API)
- serviceusage.googleapis.com (Service Usage API)
Run the below command to enable the required APIs
gcloud --project=MYPROJECT services enable \
    cloudresourcemanager.googleapis.com \
    iam.googleapis.com \
    logging.googleapis.com \
    serviceusage.googleapis.com
Authentication
gcpdiag supports authentication using multiple mechanisms:
- OAuth user consent flow — gcpdiag uses the OAuth user authentication flow by default, similar to what gcloud command uses.
- Application default credentials — gcpdiag can use Cloud SDK’s Application Default Credentials. This might require that you first run
gcloud auth login --update-adcto update the cached credentials. - Service account key — You can also use the
--auth-keyparameter to specify the private key of a service account.
Permission required for gcpdiag
The user/service account running gcpdiag must have 2 permissions.
- Viewer
- Service Usage Consumer
The recommended way is to create a service account with the “viewer” + “service usage consumer” role, download the key use with the flag (--auth-key)
gcpdiag lint --project=Myproject --auth-key File_PathYou are all set to troubleshoot your Google Cloud projects to make them more secure.
You can do so much with gcpdiag — Use python to parse the output of gcpdiag in much more compact, readable way. You can create your own linter with gcpdiag, and use it in Github-Actions workflow.
References:
https://gcpdiag.dev/docs
https://github.com/GoogleCloudPlatform/gcpdiag
