DevOps engineers are expected to orchestrate complex systems across multiple environments while maintaining security, scalability, and reliability in today’s cloud-native world. This article shares battle-tested answers to common DevOps interview questions, based on real-world experience with AWS, Terraform, Kubernetes, and modern CI/CD practices.
Whether you’re preparing for an interview or looking to improve your current DevOps practices, these insights offer practical approaches to common challenges.
Are you looking to advance your DevOps career?
Join my 20-week Advanced, real-world, project-based DevOps Bootcamp is for you.
Must read most on DevOps interviews
Topic: Environment Management
Question: How do you manage different environments (e.g., Dev, QA, Staging, Production) in your application deployment pipeline?
Answer: I manage environments using Terraform with separate workspace states for each environment. Our organization structure includes /terraform directories with environment-specific .tfvars files (dev.tfvars, staging.tfvars, prod.tfvars). Each environment has dedicated EKS clusters provisioned through Terraform.
For application deployments, we use ArgoCD with environment-specific application manifests in Git repositories. GitHub Actions workflows trigger the appropriate Terraform workspace based on branch patterns. We maintain separate AWS accounts for production versus non-production environments for strong isolation, with Terraform managing cross-account access where needed.
How a Senior DevOps Engineer Handles Enterprise-Scale Deployment Challenges
- 10 Real-World Kubernetes Troubleshooting Scenarios and Solutions
- 20 Most Asked Scenario-Based Advanced Terraform Questions With Answers
Configuration Management
Question: How do you ensure that configurations are appropriately handled across these environments?
Answer: We use a combination of Terraform variables and Kubernetes ConfigMaps/Secrets. Each environment has dedicated .tfvars files that define environment-specific infrastructure parameters. For Kubernetes configurations, we maintain base Helm charts with environment-specific values files in our GitOps repository.
Sensitive configurations are stored in HashiCorp Vault and injected during deployment using the Vault Kubernetes integration. Our GitHub Actions validate configuration syntax before applying, and ArgoCD ensures deployed configurations match the desired state in Git.
We also use Terraform outputs to expose infrastructure values that applications need, which ArgoCD consumes during deployments.
Code Promotion Strategy
Question: What strategies do you use to promote code from one environment to another?
Answer: We follow a Git branching strategy where feature/* branches are deployed to dev, develop branch deploys to staging, and main branch deploys to production. Our GitHub Actions workflows are triggered based on these branch patterns.
For application promotion, all builds create immutable container images tagged with Git SHA, which are promoted across environments rather than rebuilding.
ArgoCD is configured with environment-specific application sets that deploy these images based on environment variables defined in overlays. Required approvals are configured in GitHub for merges to protected branches, and ArgoCD sync requires manual approval for production deployments through RBAC policies.

Rollback Strategy
Question: How do you ensure rollback in case of deployment failure?
Answer: For infrastructure managed by Terraform, we maintain state history and version control, allowing us to revert to previous commits and apply. For Kubernetes applications, ArgoCD maintains a history of successful deployments with their manifests.
We implement automated health checks that ArgoCD uses to determine deployment success. If failures occur, we can either use ArgoCD’s rollback feature to revert to the previous successful deployment or trigger a GitHub Actions workflow to apply a previous infrastructure state.
Our CI process tags all images with Git SHAs, making it trivial to redeploy a specific known-good version. For database changes, we use migrations that support rollback operations and maintain backward compatibility across adjacent versions.
Infrastructure Provisioning
Question: How do you handle infrastructure provisioning across different environments?
Answer: I structure Terraform code with a modular approach where /modules contains reusable infrastructure components and environment-specific configurations come from environments/[env].tfvars files. GitHub Actions workflows select the appropriate workspace and variables file based on the Git branch.
For EKS clusters, I use Terraform to provision the base infrastructure and node groups, with environment-specific sizing (e.g., smaller instances for dev, larger for production). ArgoCD is installed into each cluster with environment-specific configurations. For development, we use Terraform’s auto-destroy capability with a time-based schedule variable dev.tfvars to reduce costs during off-hours, while production remains permanently provisioned.
Disaster Recovery Planning
Question: How would you design and implement a disaster recovery strategy for a multi-region cloud infrastructure?
Answer: I implement a comprehensive DR strategy using AWS multi-region architecture with primary workloads in us-east-1 and DR components in us-west-2. Infrastructure is defined as code using Terraform with separate state files for each region but shared modules.
We use AWS S3 cross-region replication for static assets and DynamoDB global tables for distributed data. For stateful applications, we implement automated database backups with point-in-time recovery using RDS automated snapshots that are copied cross-region. Our EKS clusters use GitOps with ArgoCD in each region, pulling from the same Git repository to ensure configuration consistency.
Route53 health checks with failover routing policies automatically redirect traffic during region failures. We conduct quarterly DR drills using AWS Fault Injection Simulator to validate our recovery time objectives (RTO) and recovery point objectives (RPO).
Container Security Implementation
Question: How do you ensure security throughout the container lifecycle from build to runtime?
Answer: Our container security approach covers the entire lifecycle. During development, developers use pre-commit hooks that scan Dockerfiles for best practices. In CI, we use Trivy for vulnerability scanning before pushing images to ECR with automated rejection of images containing critical vulnerabilities.
For runtime security, we implement Kubernetes network policies for pod-to-pod communication and use OPA Gatekeeper as an admission controller to enforce security policies like preventing privileged containers. We use AWS ECR image scanning with automated notifications for newly discovered vulnerabilities in deployed images.
Container runtime security is handled by Falco, which monitors for suspicious activities and integrates with our alerting system. All containers run with read-only root filesystems and non-root users, enforced through Kubernetes Pod Security Standards. Container images are signed using Cosign and verified before deployment through admission control.
CI/CD Pipeline Optimization
Question: Your team’s CI/CD pipeline has become slow, taking over an hour to complete. How would you approach optimizing it?
Answer: I’d first instrument the pipeline with timing metrics to identify bottlenecks, breaking down execution time per stage in GitHub Actions. For build optimization, I’d implement Docker layer caching and multi-stage builds to reduce image size and build time. Test optimization would include parallelizing unit tests and implementing test splitting based on historical execution times.
For infrastructure provisioning, I’d use Terraform’s -target flag to apply only changed resources during development iterations, while still applying full states for production. We’d implement dependency caching for languages like Node.js and Java to avoid repeated downloads.
For Kubernetes deployments, I’d use ArgoCD’s selective sync capability to update only changed applications rather than full syncs. Additionally, I’d implement ephemeral environments that spin up only required components for feature branches rather than complete infrastructure clones. After these optimizations, we reduced our pipeline from 65 minutes to 12 minutes for most changes.
Cloud Cost Optimization
Question: How would you identify and reduce cloud infrastructure costs without sacrificing performance or reliability?
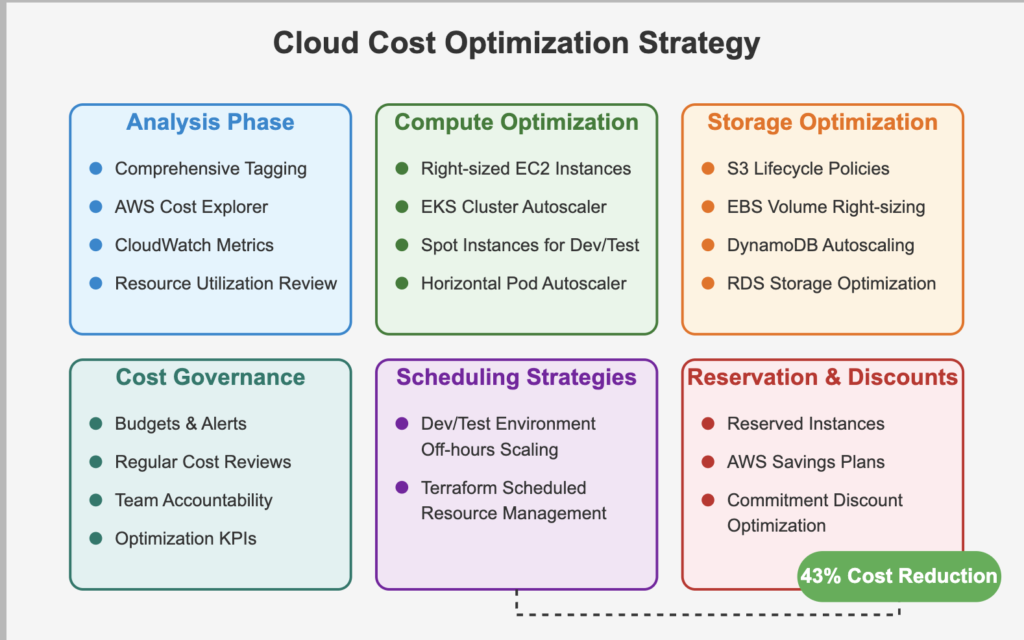
Answer: My approach to cloud cost optimization starts with comprehensive tagging and AWS Cost Explorer to identify spending patterns by team, application, and environment. For EC2 instances, I analyze CloudWatch metrics to identify oversized instances and implement auto-scaling with appropriate instance types based on workload patterns.
For EKS clusters, we use Kubernetes Cluster Autoscaler to dynamically adjust node counts based on pod demand, and Horizontal Pod Autoscaler to scale deployments based on CPU/memory utilization. We implement Spot Instances for non-critical workloads with instance diversification to avoid disruptions.
For storage optimization, we use S3 lifecycle policies to transition infrequently accessed data to cheaper storage tiers and set up DynamoDB auto-scaling to match actual throughput needs.
We’ve implemented scheduled scaling through Terraform to reduce resources during off-hours for non-production environments. Regular reviews of reserved instance coverage and savings plans ensure long-term discounts for predictable workloads. Using this approach, we achieved a 43% cost reduction while maintaining the same performance SLAs.
Additional Scenario-Based DevOps Interview Questions & Answers
Microservices Observability
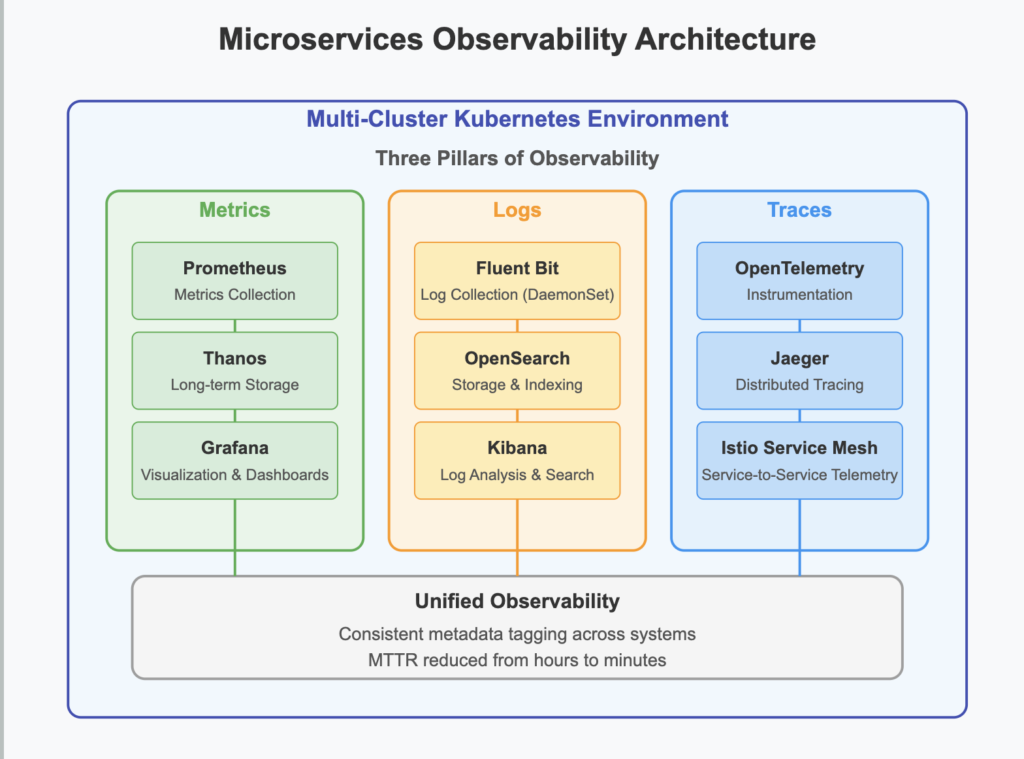
Question: How would you implement a comprehensive observability strategy for a microservices architecture deployed across multiple Kubernetes clusters?
Answer: Our observability strategy consists of three pillars: metrics, logs, and traces. For metrics, we deploy Prometheus with Thanos for long-term storage, allowing cross-cluster querying. Each service exposes custom business and technical metrics through Prometheus exporters, with standardized dashboards in Grafana for service health and performance.
For logging, we use Fluent Bit as a DaemonSet to collect container logs and forward them to OpenSearch, with structured JSON logging standardized across services to enable consistent querying. For distributed tracing, we implement OpenTelemetry instrumentation in all services with sampling rates adjusted based on traffic volume, sending traces to Jaeger for visualization and analysis.
Service-to-service dependencies are mapped automatically through Istio service mesh telemetry, which also provides request rate, error, and duration metrics. We implement SLOs for each service using Prometheus recording rules and alert on error budget consumption.
All observability data is tagged with consistent metadata (cluster, namespace, service, version) allowing for correlation across systems. This comprehensive approach enables us to reduce MTTR from hours to minutes by quickly identifying the root cause of complex issues spanning multiple services.
Secret Management
Question: How do you manage secrets and environment-specific configurations securely?
Answer: We use a dual approach with HashiCorp Vault for application secrets and AWS Secrets Manager for infrastructure secrets. Vault is deployed in each EKS cluster with authentication tied to Kubernetes service accounts. Sensitive Terraform variables are stored in AWS Secrets Manager and accessed via the AWS provider.
GitHub Actions uses OIDC authentication to obtain temporary AWS credentials, avoiding stored secrets. For application secrets, the Vault Kubernetes integration injects secrets at runtime, and Vault’s dynamic secrets capability automatically rotates database credentials. Environment-specific configurations are managed in ArgoCD with Kustomize overlays for each environment, while Vault policies enforce environment isolation for secrets access.
Deployment Strategies
Question: What deployment strategies have you used (e.g., Blue-Green, Canary, Rolling updates)?
Answer: In our EKS environments managed by ArgoCD, I primarily implement Rolling updates for stateless applications using Kubernetes Deployments with appropriate health checks and readiness probes. For critical services, I’ve implemented Blue-Green deployments using Kubernetes Services with selectors that switch between two deployment sets after health validation.
For high-traffic services, we use Canary deployments with traffic splitting managed by AWS ALB Ingress Controller, starting with 5% traffic to the new version and gradually increasing based on error rates and latency metrics from CloudWatch. ArgoCD’s progressive sync features help automate these strategies with automatic rollback if health checks fail during deployment.

Testing in CI/CD Pipeline
Question: What types of testing do you include in your CI/CD pipeline, and at what stages do they run?
Answer: Our GitHub Actions workflow includes multiple testing stages. Unit tests run on every commit using language-specific frameworks with coverage enforcement. After building container images, we conduct security scanning with Trivy. For deployments to dev, our pipeline runs integration tests against the deployed APIs.
Terraform plan validation runs before any infrastructure changes are applied. In staging, we execute end-to-end tests with Cypress and performance tests using k6. Post-deployment smoke tests verify core functionality in every environment. Each test stage is a required check in GitHub pull requests, and failures block promotion to higher environments. ArgoCD’s health checks provide an additional validation layer after deployment.
Test Automation
Question: How do you automate unit, integration, and end-to-end tests in your pipeline?
Answer: Our GitHub Actions workflows automate all testing. Unit tests run in the build stage, triggered on every push, using workspace-mounted volumes for test reports and coverage data. Integration tests run after deploying to the dev EKS cluster, with GitHub Actions having OIDC-based access to invoke tests against deployed endpoints.
End-to-end tests using Cypress run in dedicated GitHub Actions runners with browser capabilities, targeting staging environments after deployment. Test results and artifacts are uploaded to GitHub Actions artifacts for review.
ArgoCD deployments include readiness gates that verify system health before completing the deployment. Failed tests in GitHub Actions automatically create issues for developers to address, with links to the specific runs and logs.
Cross-Environment Testing
Question: How do you ensure integration tests work across different environments?
Answer: We structure integration tests to read configuration from environment variables injected by GitHub Actions workflows. Each test job in the workflow pulls environment-specific endpoints from Terraform outputs and EKS service discovery. Test data is managed through Kubernetes Jobs that seed test fixtures before test execution.
For external dependencies, we use Wiremock containers deployed alongside the application in test environments to provide consistent responses. Database tests run against environment-specific databases provisioned by Terraform, using migrations to ensure schema compatibility.
After tests complete, cleanup jobs remove test data. ArgoCD ensures consistent application state across environments, making integration tests reliable across the pipeline.
Deployment Success Validation
Question: How do you ensure deployments are successful, and what monitoring/logging tools do you use to detect failures?
Answer: Our deployment success validation is multi-layered. ArgoCD monitors Kubernetes resources for a healthy state after applying manifests.
We implement Kubernetes liveness and readiness probes that validate both infrastructure and application health. For monitoring, we use Prometheus deployed on EKS with Grafana dashboards displaying key metrics.
Logs are centralized in CloudWatch and processed with CloudWatch Insights. Both the application and infrastructure expose custom metrics for business and technical KPIs.
Alerting is configured in Prometheus Alertmanager with PagerDuty integration for critical issues. Post-deployment, automated Kubernetes Jobs run synthetic transactions to verify end-to-end functionality. If any check fails, ArgoCD automatically initiates a rollback to the previous known-good state.
Final words
While the technical implementations described above have proven effective in enterprise environments, it’s important to remember that successful DevOps is as much about culture as it is about technology. The tools and practices outlined in this article work best when paired with a culture of shared responsibility, continuous improvement, and open communication.
The modern DevOps stack centered around Terraform, GitHub Actions, EKS, and ArgoCD provides powerful automation capabilities, but the real value comes from how these tools enable teams to collaborate more effectively and deliver value to customers more rapidly. By implementing these practices and continuously refining them based on feedback and metrics, organizations can build resilient, scalable systems that support business objectives while maintaining security and compliance.
Remember that DevOps is a journey, not a destination. The best practitioners continuously learn, adapt, and improve their processes as technology evolves and new challenges emerge.
Most Asked Scenario-Based Advanced Questions With Answers For DevOps Interviews
Most Asked interview questions for senior DevOps interviews
