
A Complete Guide to Better Logging in Python with loguru
I have been using Python’s built-in logging module for years, I have always found it quite boring. It cannot be customized beyond a point.
I wanted to include some color coding in my log messages, but had to use a third-party package, for it. I wished Python built-in logging module has options to customise logs with ease.
Then I stumbled upon loguru and found it interesting. I spent some time with this yesterday and fell in love with it.
By the end of this blog post, you will fall for it too.
Also, read these posts on Python
- Running Multiple Python Versions with Pyenv
- Generate requirements.txt for your Python project on the fly
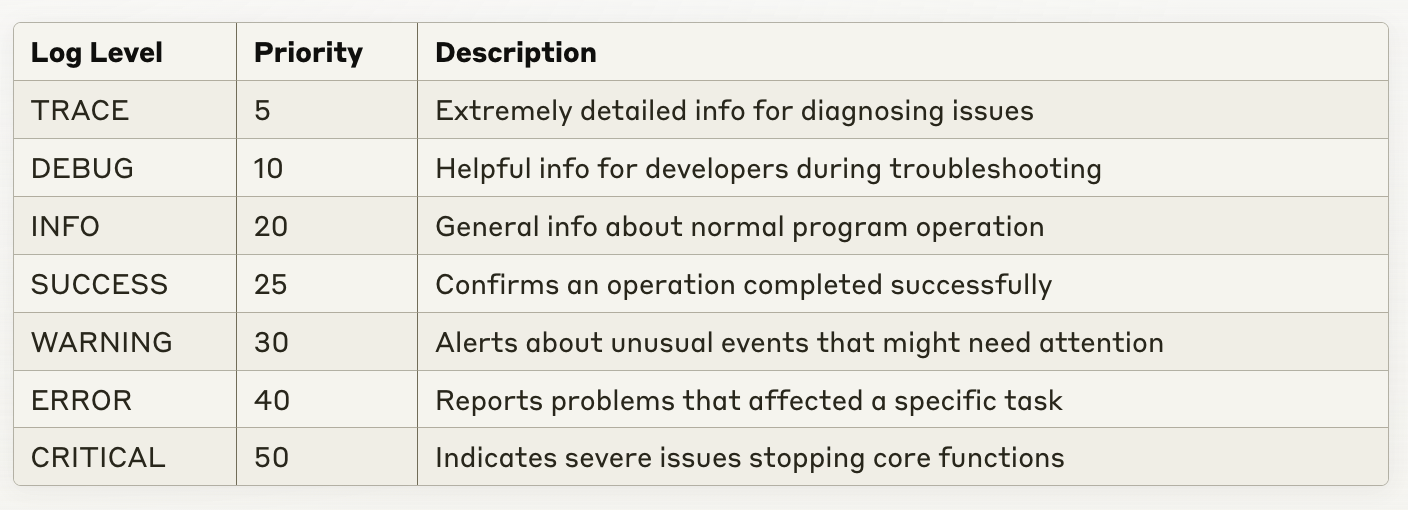
When talking about logging, loglevel is an important term, they are like a severity scale for your messages. By assigning different levels to log messages, it becomes easier to focus on critical issues while reducing noise from less important events while troubleshooting or monitoring.
While the Python builtin module comes with DEBUG, INFO, WARNING, ERROR, and CRITICAL, loguru include 2 more log levels, TRACE and SUCCESS.
Here is the table to remember log levels in order of increasing priority.
Enough with the talking, let me show you what we can do withlogguru and why I fell in love with it.
Installing Loguru with pip
pip install loguru
To use Loguru, import the logger from loguru module and use it.
from loguru import logger

logger.trace("Hi, This is Akhilesh Mishra")
logger.debug("I will show how to use loguru for better logging in python")
logger.info(" I love how the logs look")
logger.warning("Different color of each section of log")
logger.error("Easy to get started with")
logger.critical( "So many options to choose from")
logger.success(" You see what i am talking about")
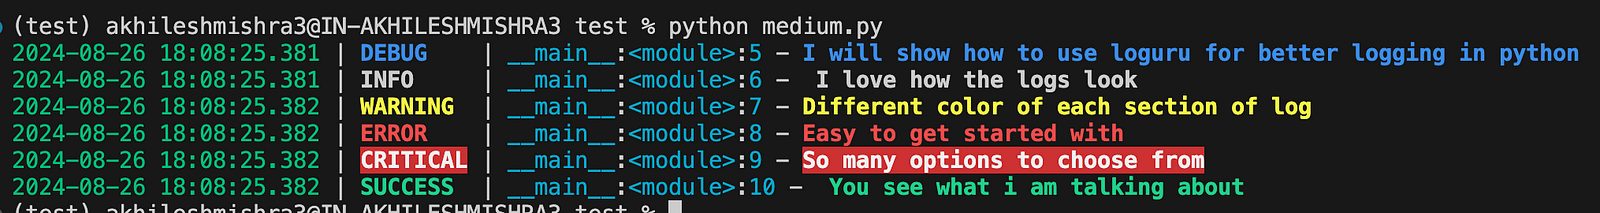
date | level | file location: scope: line number - message
You can see in the above screenshot that the trace output is not printed. Default log level for loguru is debug.
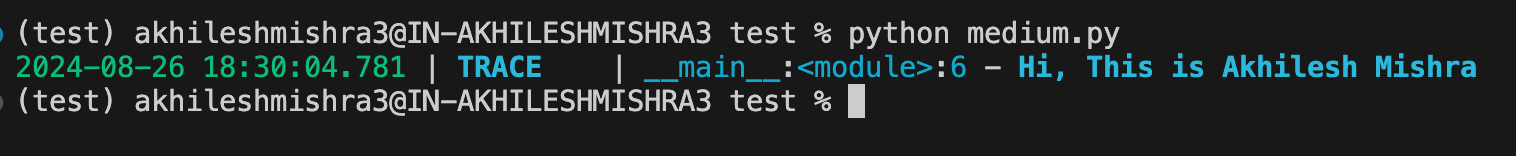
Changing the default log level in loguru
We can use logger’s add() function to change the default loglevel, update the log’s formatting.
import sys
from loguru import logger

logger.add(sys.stderr, level="TRACE")
logger.trace("Hi, This is Akhilesh Mishra")
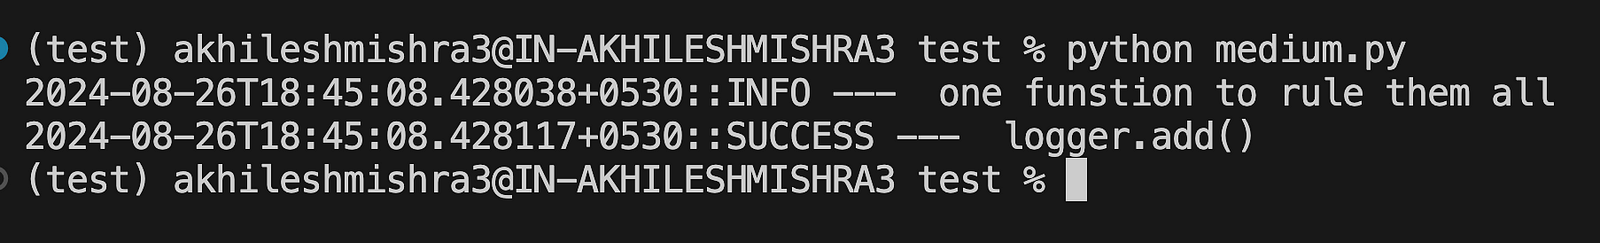
Change the formatting with loguru
Unlike Python’s built-in logging module, you can add a handler, update formatting, and change the log level in just one line — with add() function.
import sys
from loguru import logger

logger.remove() # remove the old formatting
logger.add( sys.stdout, format="{time}::{level} --- {message}", level="INFO")

logger.debug(" Add a handler, update formatting, and change the loglevel")
logger.info(" one funstion to rule them all")
logger.success(" logger.add()")
Pretty logging with colors
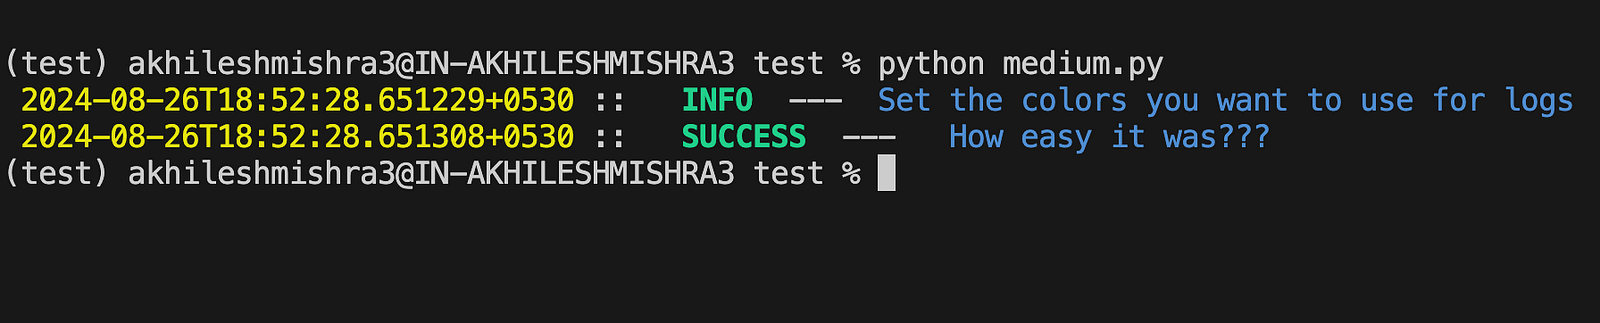
You can change the color of these output messages by using HTML like syntax.
logger.remove()
logger.add(
    sys.stdout,
    format=" <yellow>{time} </yellow>:: <green> <bold> {level} </bold> </green>--- <blue> {message} </blue>",
)

logger.info("Set the colors you want to use for logs")
logger.success(" How easy it was???")
Change the time formatting
import sys
from loguru import logger
logger.remove()
# MMMM D, YYYY > HH:mm:ss!UTC : UTC time
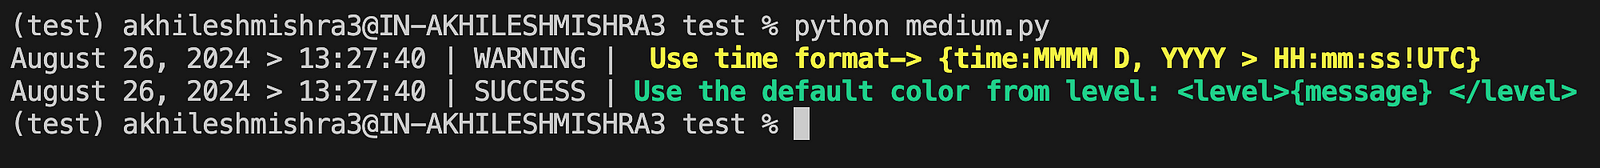
logger.add(sys.stderr, format="{time:MMMM D, YYYY > HH:mm:ss!UTC} | {level} | <level>{message} </level>")
logger.warning(" Use time format-> {time:MMMM D, YYYY > HH:mm:ss!UTC}")
logger.success("Use the default color from level: <level>{message} </level>")
You can use more options with time, use this link to know more time formatting options.
Sending logs to a file
Loguru sends logs to the console by default, but you can configure it to send logs to a file.
logger.add("log_file_demo.log")
Let’s use formatted logs
from loguru import logger
logger.remove()
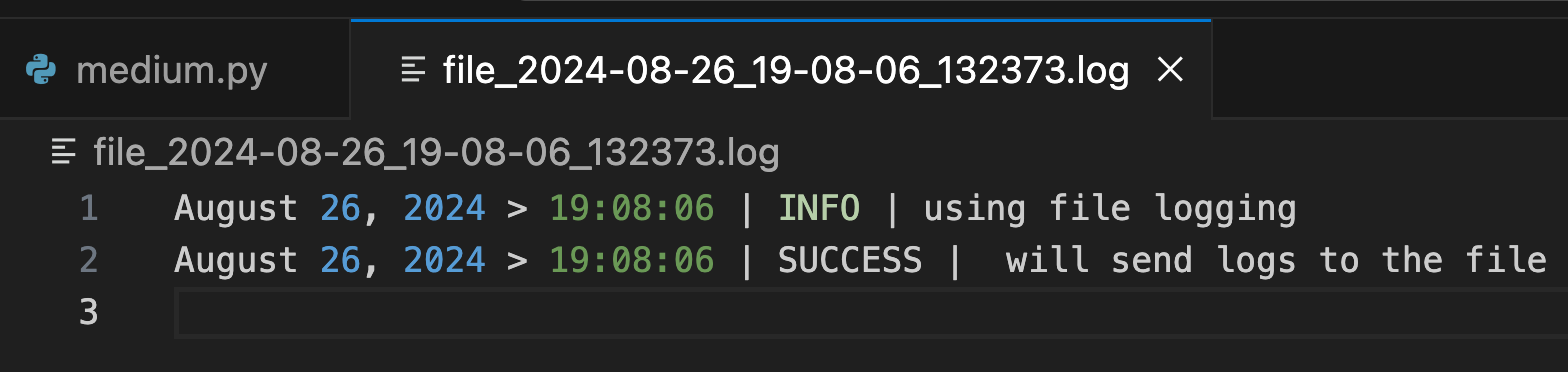
logger.add("file_{time}.log", format="{time:MMMM D, YYYY > HH:mm:ss} | {level} | <level>{message} </level>")
logger.info("using file logging")
logger.success(" will send logs to the file")
Loguru also allows you to rotate/retain/compress logs with time and size filters.
logger.add("log_rotate.log", rotation="500 MB")    # Automatically rotate too big file
logger.add("log_rotate2.log", rotation="12:00")     # New file is created each day at noon
logger.add("log_rotate3.log", rotation="1 week")    # Once the file is too old, it's rotated

logger.add("log_retention.log", retention="10 days")  # Cleanup after some time

logger.add("log_retention2.log", compression="zip")    # Save some loved space
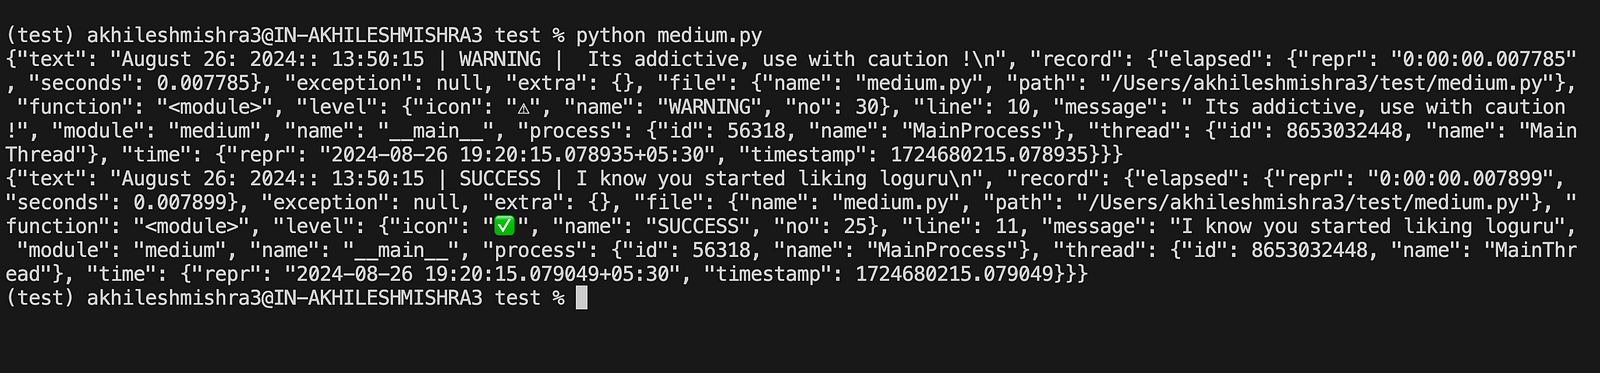
Loguru supports logging in JSON format with serialize=True option.
import sys
from loguru import logger

logger.remove(0)
logger.add(
    sys.stderr,
    format="{time:MMMM D: YYYY:: HH:mm:ss!UTC} | {level} | {message}",
    serialize=True,
)
logger.warning(" Its addictive, use with caution !")
logger.success("I know you started liking loguru")
Adding context to log messages with loguru
Suppose you want to add some additional information to the log message for context, you can use the bind() method.
- You can add directive
extrato the format in your loggeradd()method to add custom entries to the logs output.
import sys
from loguru import logger
# Remove the default logger
logger.remove(0)
# Add a new logger that outputs to sys.stderr
logger.add(
sys.stderr,
format=" {level} | <level>{message}</level> | {extra} ",
)
# Create a new logger with some initial context
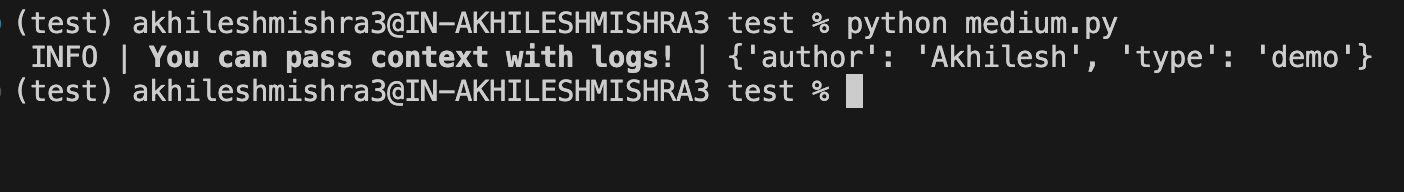
context_logger = logger.bind(author="Akhilesh", type="demo")
# Log an info message with the current context
context_logger.info("You can pass context with logs!")
- You can further customize the context
# Bind additional context to the logger and log a warning message
context_logger.bind(blog_type="Tutorial").warning(
    "You can use extra attributes to bind context!"
)

# Log a success message with additional context provided during formatting
context_logger.success(
    "Use kwargs to add context during formatting: {platform}", platform="Medium"
)

- We can also use the Python context manager to modify a context-local state temporarily with
contextualize()
import sys
from loguru import logger
logger.remove(0)
logger.add(
sys.stderr,
format=" {level} | <level>{message}</level> | {extra} ",
)
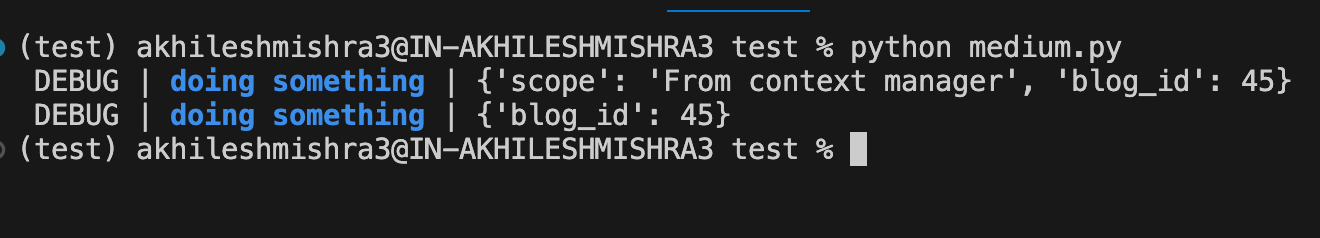
context_logger = logger.bind(blog_id=45)
def do_something():
context_logger.debug("doing something")
with logger.contextualize(scope="From context manager"):
do_something()
do_something()
- Combine
bind()andfilterfor fine-grained control over your logs.
from loguru import logger
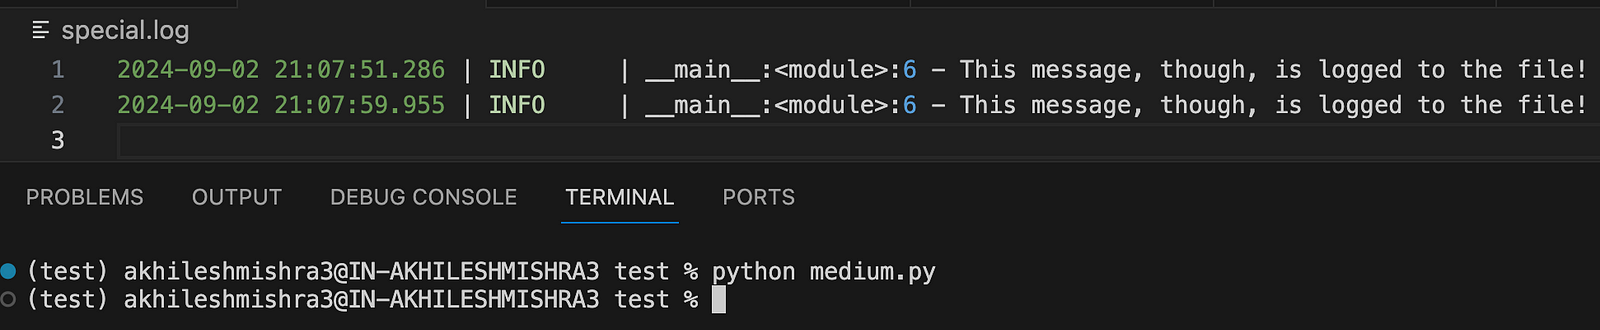
logger.add("special.log", filter=lambda record: "special" in record["extra"])
logger.debug("This message is not logged to the file")
logger.bind(special=True).info("This message, though, is logged to the file!")
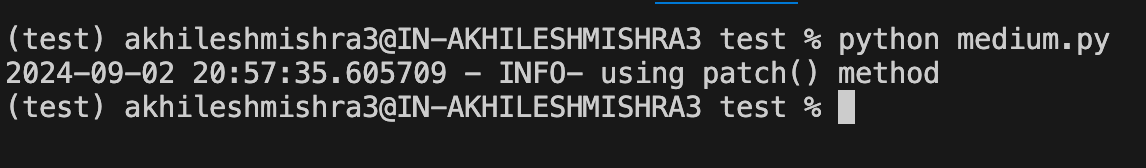
- The
patch()method allows you to attach dynamic values to be attached to each new message
import sys
from loguru import logger
from datetime import datetime

logger.remove(0)
logger.add(sys.stderr, format="{extra[utc]} - {level}- {message}")
logger = logger.patch(lambda record: record["extra"].update(utc=datetime.now()))

logger.info("using patch method from loguru")
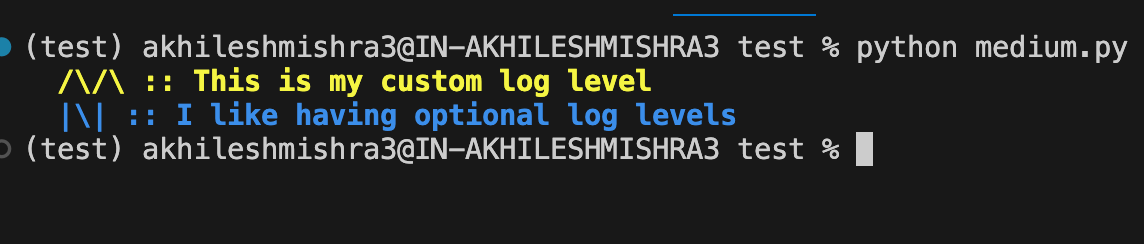
Create custom log levels
Loguru allows you to create your own log level with level() function.
import sys
from loguru import logger

logger.remove(0)

m_level = logger.level("Medium", no=45, color="<yellow><bold>", icon="/\\/\\")
n_level = logger.level("Nedium", no=45, color="<blue><bold>", icon="|\\|")

logger.add(sys.stderr, format=" <level> {level.icon} :: {message} </level>")

logger.log("Medium", "This is my custom log level")
logger.log("Nedium", "I like having optional log levels")
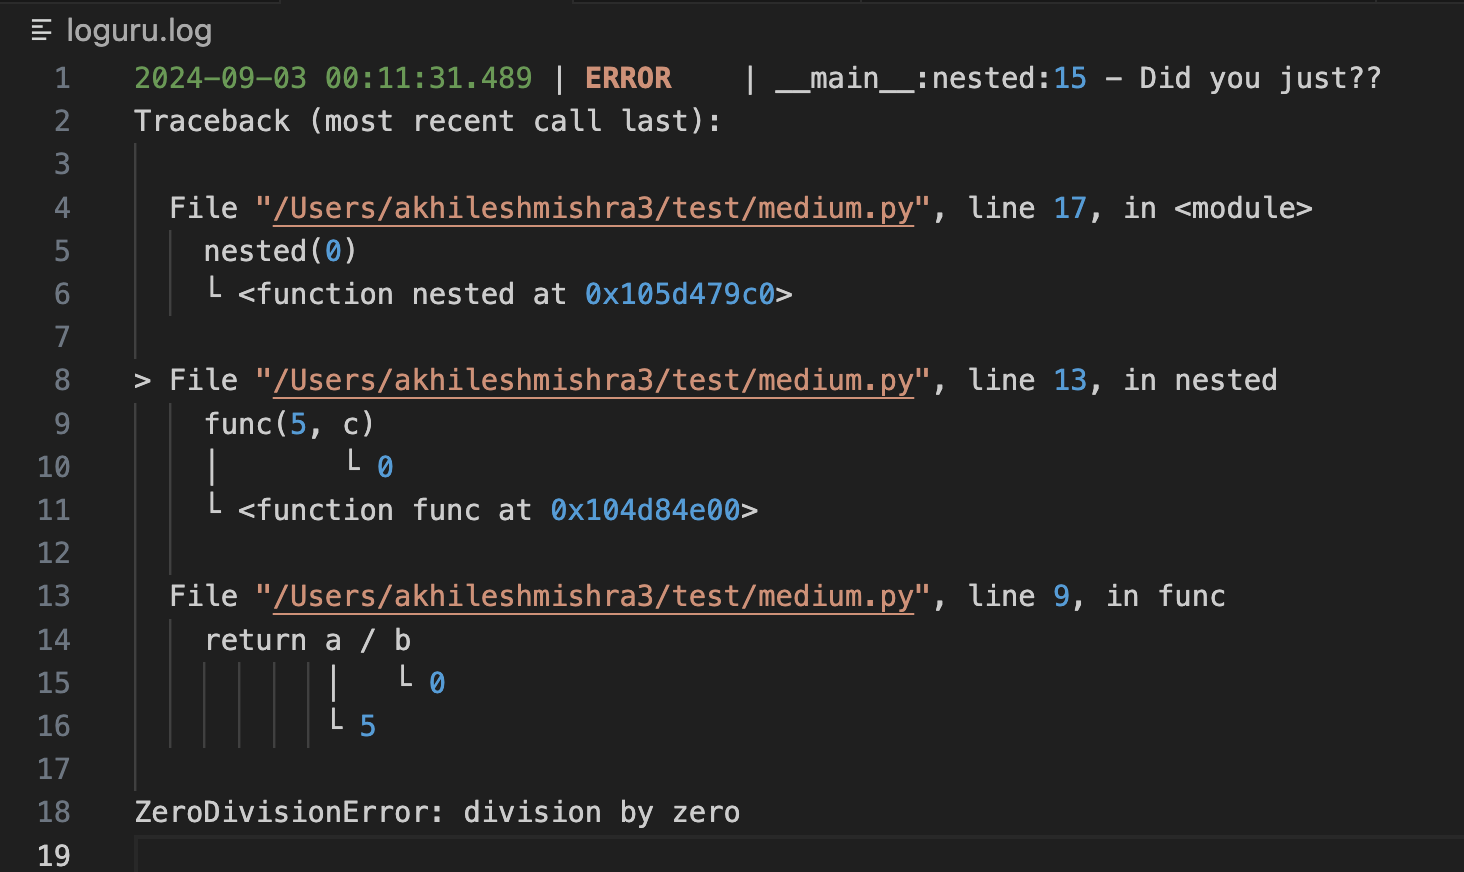
Logging exceptions with loguru
Logging exceptions is crucial for tracking bugs, but it’s not helpful if you don’t know the cause. Loguru makes it easier by showing the entire stack trace, including variable values so you can identify the problem.
Let me show you:
from loguru import logger
logger.remove(0)

# Caution, "diagnose=True" is the default and may leak sensitive data in prod
logger.add("loguru.log", backtrace=True, diagnose=True)

def func(a, b):
    return a / b

def nested(c):
    try:
        func(5, c)
    except ZeroDivisionError:
        logger.exception("Did you just??")

nested(0)
You can also use it with context manager by usinglogger.catch() decorator.
from loguru import logger
logger.remove(0)

# Caution, "diagnose=True" is the default and may leak sensitive data in prod
logger.add("loguru.log", backtrace=False, diagnose=False)

@logger.catch()
def func(a, b):
    return a / b

func(5,0)
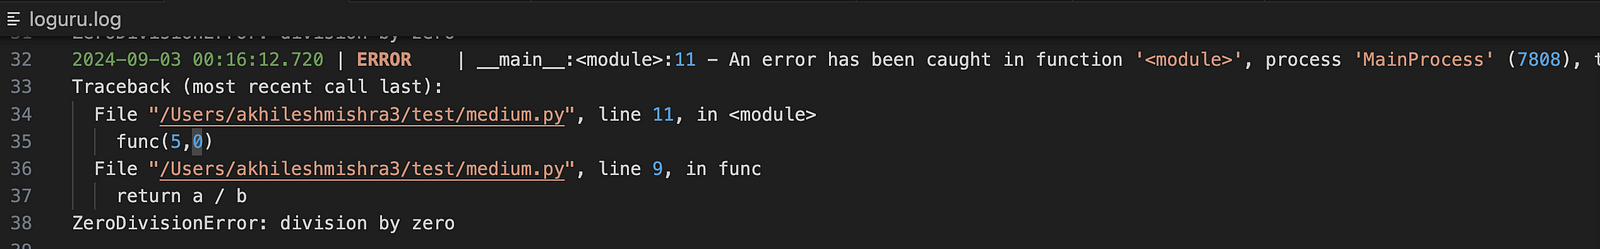
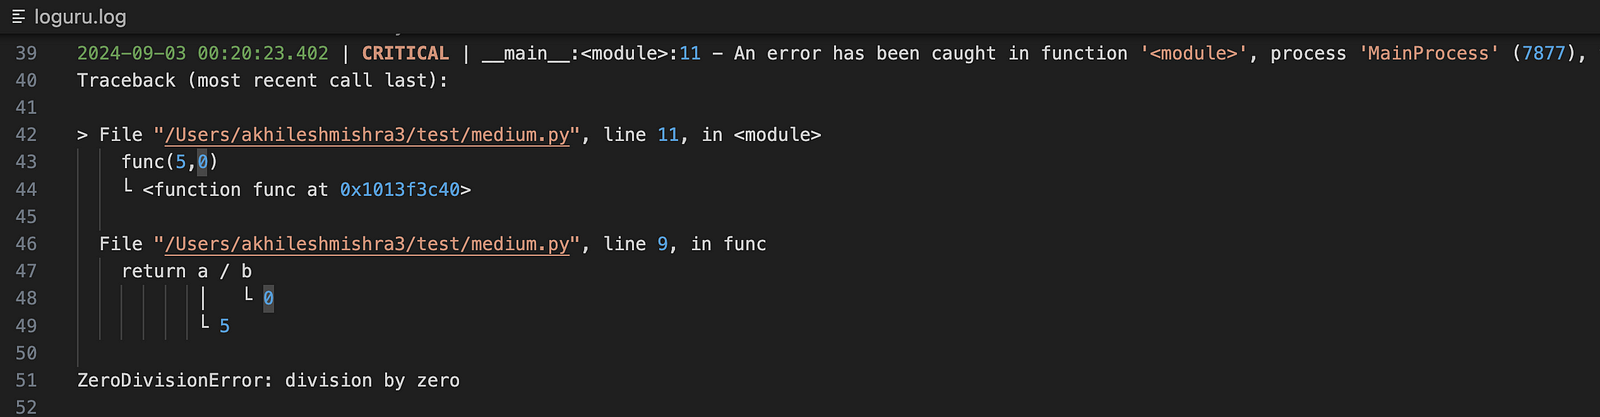
By default the level you will see ERROR level, but you can customize it to use different levels.
Final words
If you got to this point, you know how nice loguru is. If you love customization and making things pretty, you will love it.
Let me know what you think about it in the comments. If you found it useful clap, follow, and subscribe so you don’t miss my future articles.
About me
I am Akhilesh Mishra, a self-taught Devops engineer with 12+ years working on private and public cloud (GCP & AWS)technologies.
Connect with me on Linkedin: https://www.linkedin.com/in/akhilesh-mishra-0ab886124/
