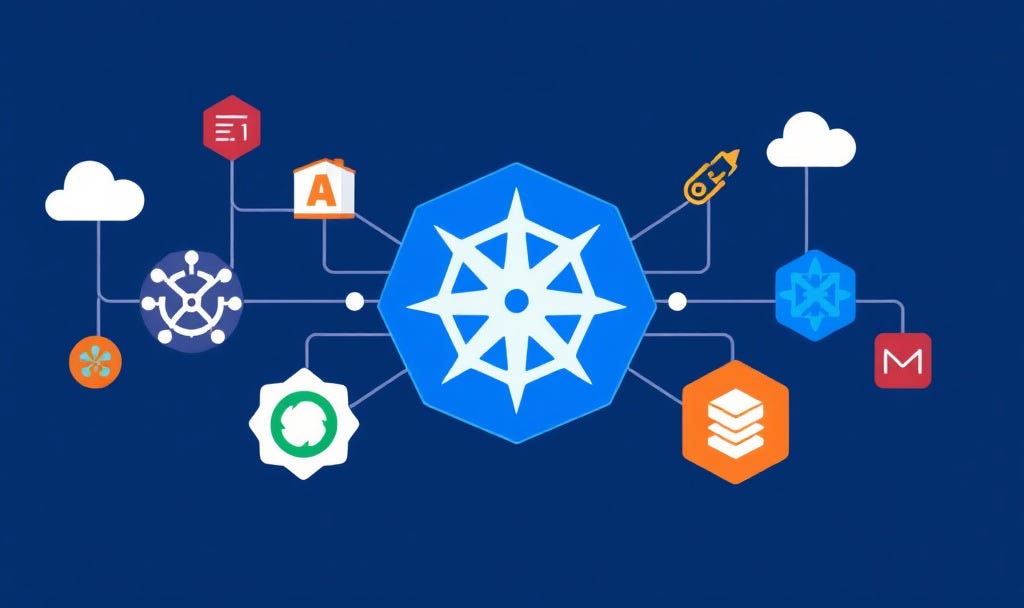
The Kubernetes Ecosystem Has a Story. Every tool exists because Kubernetes alone wasn’t enough.
Most people learn the Kubernetes ecosystem the wrong way.
They see it as a list of tools. ArgoCD. KEDA. Karpenter. Istio. Kyverno. Prometheus. They add them to their resume without understanding why they exist.
Every tool in this ecosystem exists because someone ran Kubernetes in production, something broke, and a new tool was born to fix it.
Let me show you the full story in order.
If you are new to Kubernetes, then read:
Kubernetes Isn’t Hard. You’re Learning It Backwards.
You run everything with kubectl.
Get pods. Describe. Logs. Exec. Delete. Apply.
50 times a day across 5 namespaces.
It works. But it is slow, painful and easy to run the wrong command on the wrong namespace. One typo in prod and you are having a bad day.
>> So you use K9s or Lens.
A terminal UI that shows your entire cluster in one view. Switch namespaces in one keystroke. Tail logs without typing a single command. Delete resources without remembering the exact syntax.
kubectl was powerful but painful at scale. K9s and Lens fixed that.
But visibility is only half the problem. Deployment is the other half.
You deploy with kubectl apply from your laptop. Someone changes a deployment directly on the cluster and what is running no longer matches what is in Git. That is drift, and it is silent until prod breaks.
>> So you use ArgoCD.
Git becomes the single source of truth. Every change goes through Git and ArgoCD syncs the cluster to match automatically. If anyone touches a deployment manually, ArgoCD overrides it back. Your entire team sees what is deployed, in which cluster, from which commit. In one dashboard.
Manual deployment caused drift. ArgoCD fixed that.
Now your app is running. But scaling breaks you.
Your Kafka consumer has 200,000 messages piling up. CPU is at 5 percent. HPA sees no reason to scale. The queue keeps growing and users are waiting.
>> So you use KEDA.
KEDA scales pods on what actually matters. Queue depth, SQS message count, Prometheus metrics. Not just CPU. The backlog clears.
HPA only understood CPU. KEDA fixed that.
But scaling pods is only half the problem. Nodes are the other half.
HPA adds pods during a spike but the nodes are full and new pods sit in Pending. HPA did its job but the cluster had nowhere to put them.
>> So you use Karpenter.
A new node appears in seconds when pods are stuck in Pending and disappears when the load drops. It picks the right instance type for your workload automatically. You only pay for what you use.
Pod scaling without node scaling was half a solution. Karpenter fixed that.
Your cluster is running. But your network has no rules.
Every pod can talk to every other pod by default. Your payment service can reach your database. Your internal tool can reach your logging service. Nothing is blocked unless you block it.
>> So you use Network Policies.
Rules that define which pods can talk to which. Your database only accepts traffic from the app. Everything else is denied. The blast radius of a compromised pod shrinks dramatically.
An open network is a risk. Network Policies fixed that.
But even with rules, your traffic is still invisible.
You have 20 microservices. One starts responding slowly and retries pile up across 4 other services. A cascade begins and you have no visibility into where it started because all traffic between services is invisible.
>> So you use a Service Mesh.
Istio or Linkerd puts a sidecar proxy next to every pod. mTLS between every service, retries, circuit breaking and traffic metrics. All without touching a single line of app code.
Invisible traffic made debugging impossible. A Service Mesh fixed that.
Now let’s talk about secrets. Because everyone gets this wrong.
Your secrets are Base64 encoded in Kubernetes, sitting in etcd and readable by anyone with kubectl access. You want them in Vault or AWS Secrets Manager but you do not want to rewrite your app to fetch them.
>> So you use the Secrets Store CSI Driver.
Secrets live in Vault or AWS Secrets Manager and get mounted directly into your pod as files. Your app reads them like any normal file. The secret never lives in Kubernetes.
Kubernetes Secrets were not secure enough. The CSI Driver fixed that.
But secrets are only one security problem. Admission is the other.
A developer ships a container running as root. Another ships with no resource limits. Another uses a public image with no digest. You find out after the incident. Every time.
>> So you use Kyverno.
Policies enforced at admission before anything enters the cluster. No root containers. No images without a digest. No deployments without limits. The mistake never makes it in.
No guardrails meant incidents. Kyverno fixed that.
Your cluster is secure. But when something goes wrong, you are flying blind.
Pods are restarting, latency is spiking and memory is climbing but you have no numbers, no history and no way to know when it started.
>> So you use Prometheus and Grafana.
Prometheus scrapes metrics from every pod, node and component in your cluster. Grafana turns those numbers into dashboards. You see the spike, the exact time it started and which service caused it.
No numbers meant no answers. Prometheus and Grafana fixed that.
But metrics tell you something is wrong. Not where.
Grafana shows the spike but not which request triggered it, which service it hit first or where it slowed down. Logs give you fragments. Metrics give you totals. Neither gives you the full story.
>> So you use Jaeger.
It follows one request across every service it touches. Latency per hop, exact failure point, full request path in one view. The needle in the haystack, found in seconds.
Metrics and logs could not connect the dots. Jaeger fixed that.
To summarize the full story:
kubectl was painful at scale. K9s and Lens fixed that.
Manual deployment caused drift. ArgoCD fixed that.
HPA only understood CPU. KEDA fixed that.
Pod scaling without node scaling left pods Pending. Karpenter fixed that.
An open network was a risk. Network Policies fixed that.
Invisible traffic made debugging impossible. A Service Mesh fixed that.
Kubernetes Secrets were not secure enough. The CSI Driver fixed that.
No guardrails meant incidents. Kyverno fixed that.
No numbers meant no answers. Prometheus and Grafana fixed that.
Metrics and logs could not connect the dots. Jaeger fixed that.
Each tool exists because the previous layer was not enough.
That is how you stop collecting tools and start understanding them.
I hope you learned something new today.
If you are planning to transition into Devops/MLops/AIops from another domain, then consider my real-world production projects and live, troubleshooting-based, 25-week bootcamp
